What is exploitation-exploration? and what is the multi-armed bandit method?

Exploitation: use the best performing model

Exploration: take actions of unknown performance

The multi-armed bandit method: We pre-define some probability p, with which we choose between exploration and exploitation. With probability p we randomly select any available action, and with probability 1-p we exploit the empirically best action. During the runtime, we monitor the KPIs to know which action is currently the best one, and update the statistics as we get more feedback.

Java: Data Science Made Easy; Richard M. Reese, Jennifer L. Reese, Alexey Grigorev 

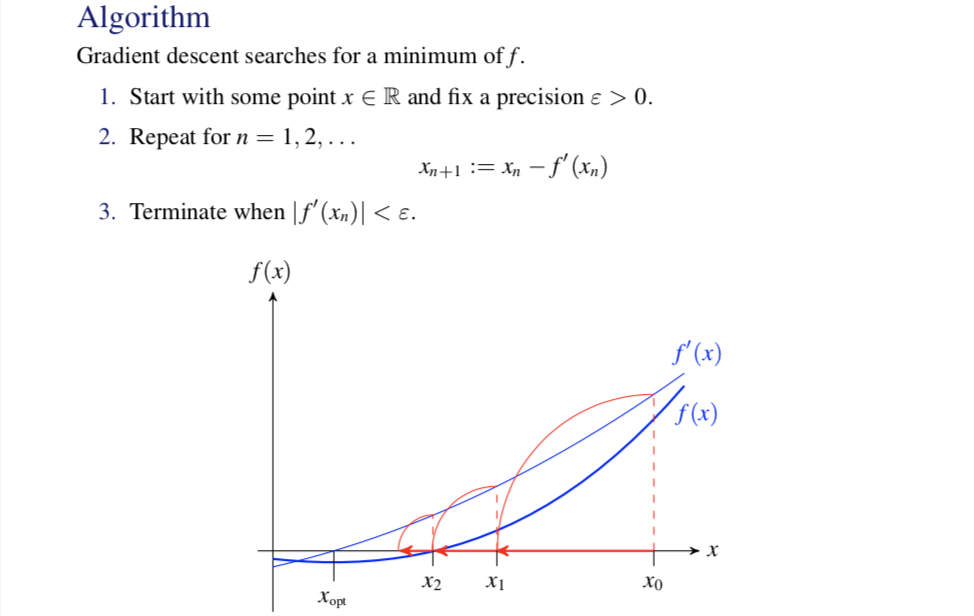
What is a (stochastic) gradient descent ?

Gradient Descent

Screen Shot 2018-03-01 at 2.53.05 AM.png

We can apply different learning rates, which is the pace of adjustment to the weights. If f is a multi-variable function, we use the gradient of f instead of f'. We are subtracting the gradient at each iteration, because we want to move away from the gradient, toward the minimum. 

STAT 4400: Statistical Machine Learning; Columbia University

Stochastic Gradient Descent

Gradient descent has to scan through the entire training set before taking a single step—a costly operation if m is large—stochastic gradient descent can start making progress right away. We repeatedly run through the training set, and each time we encounter a training example, we update the parameters according to the gradient of the error with respect to that single training example only. Often, stochastic gradient descent gets θ “close” to the minimum much faster than gradient descent.

CS 229: Machine Learning; Stanford University


How would you explain linear regression to someone without a technical background?

To grasp the basic concept, take the simplest form of a regression: a linear, bivariate regression, which describes an unchanging relationship between two (and not more) phenomena. Now suppose you are wondering if there is a connection between the time high school students spend doing French homework, and the grades they receive. These types of data can be plotted as points on a graph, where the x-axis is the average number of hours per week a student studies, and the y-axis represents exam scores out of 100. Together, the data points will typically scatter a bit on the graph. The regression analysis creates the single line that best summarizes the distribution of points.

http://news.mit.edu/2010/explained-reg-analysis-0316

What is the difference between “likelihood” and “probability”?

Probability:

Consider an experiment whose sample space is S. For each event E of the sample space S we assume that a number P(E) is defined and satisfies the following three axioms.

Axiom 1.  

Screen Shot 2018-01-22 at 9.10.08 PM.png

Axiom 2.  

Screen Shot 2018-01-22 at 9.18.23 PM.png

Axiom 3. For any sequence of mutually exclusive events E1, E2, ...

Screen Shot 2018-01-22 at 9.21.14 PM.png

We refer to P(E) as the probability of the event E.

Likelihood:

The distribution of a parameter before observing any data is called the prior distribution of the parameter. The conditional distribution of the parameter given the observed data is called the posterior distribution. If we plug the observed values of the data into the conditional p.f. or p.d.f. of the data given the parameter, the result is a function of the parameter alone, which is called the likelihood function.

Probability and Statistics, Fourth Edition, M.H. DeGroot and M. J. Schervish

Likelihood is NOT probability, because likelihood violates the three axioms. For example, we observe x=5 for an exponential distribution with an unknown parameter p. Then the support of the likelihood function is p>0. If the likelihood function is probability, then we must have the following expression

Screen Shot 2018-01-23 at 5.38.45 PM.png

equals to 1. However, the expression gives 0.04.

Submitted by TaeYoung


What is a cross-validation and what is an overfitting ?

A model, which has a very high accuracy on the training set but a very poor performance on the test set is consider to have over-fit the data. This generally means that a highly complex model was chosen to reduce training bias to almost zero, which could've violated the bias-variance trade-off. To avoid over-fitting, data scientists employ cross-validation. This technique essentially divides the training data-set into several parts, say N, and in each iteration trains the model on different (N-1) parts as well as tests the accuracy on the remaining training data part called the validation data. This considers the performance of the model on new data (i.e. validation data) and avoids over-fitting.

Submitted by fenil.doshi


Cross-validation is a technique for testing a model by using different slices of the data and comparing its results on different sets of data. Overfitting is when the model has "memorized" the training data and produces what looks like an accurate model but cannot be generalized or as reliable with new data it is not familiar with.

Submitted by john.rosenfelder

What is a Bias-Variance Tradeoff ?

Changing the function/model impacts the bias and variance.

  • The bias refers to the model’s ability, on average, to closely predict the response variable in the training dataset

  • The variance refers to the model’s stability, or how much the predictions would change if we had different training datasets

There is typically a tradeoff between bias and variance:

  • A very flexible model will result in lower bias on the training data, but will typically have higher variance across different training datasets.

  • A very inflexible model will result in higher bias on the training data, but will typically have smaller variance across different training datasets.

IEOR 4650E: Business Analytics; Columbia University